Like many gardeners in North America, every spring I eagerly await my first sighting of a ruby-throated hummingbird. So, when I was pondering what might make a good first self-directed data analytics project, the answer was literally flying in my backyard.
After what had been an early but overall cool spring, I found it harder than usual to predict what would bloom when, and I wondered: If the flowers were so affected, what about the birds that fed on them? Is climate change affecting their patterns? In early springs or late falls, are they around in North America (instead of Central America) for a longer time?
I’m not a biologist, and I’m sure the migration instinct is more complex than this, but it made for an interesting question I could answer. I thought the data would show a longer “hummingbird season” for years with mild or short winters. Since 2023 is still in progress, I decided to examine data from my county, Henrico County, Virginia, for 2013-2022. I chose to focus only on the most commonly seen hummingbird around here, the ruby-throated hummingbird, as other species are rare in this region. From here on out, I’ll simply refer to ruby-throated hummingbirds as “hummingbirds.”
The Data
Daily records of maximum, minimum, and average temperatures were easy to obtain from NOAA’s data portal. I chose to work with data from the Richmond International Airport station, as that was the station with the most complete weather data for the time period. The only missing pieces were the average daily temperatures for the first three months of 2013, so I calculated those figures using the maximum and minimum daily temperatures. Thus, those figures are slightly less accurate than the other average temperatures, which would have been calculated from multiple temperature measurements throughout each day.
NOAA’s weather data included more than temperature, and that inspired another question. I had a feeling I would see fewer hummingbird sightings on rainier weeks. After all, who wants to go out bird watching (aka birding) in the rain?
The hummingbird counts came from Cornell’s eBird website, a popular resource for birders to record their sightings. The hummingbird data was recorded with weekly, rather than daily counts, so the images below will show weekly weather data as well. Another factor of note is that eBird’s weekly counts were recorded in 48, rather than 52, weeks per year, with the weeks always starting on either the 1st, 8th, 15th, or 22nd of the month. Thus, some “weeks” actually contain more than seven days.
Results
You can click through below for responsive images. Static images are also included below as I discuss the results in-depth.
First, let’s see how temperatures have changed over time. Here’s the average, minimum, and maximum temperatures (all averaged by week) at Richmond International Airport over 2013-2022.
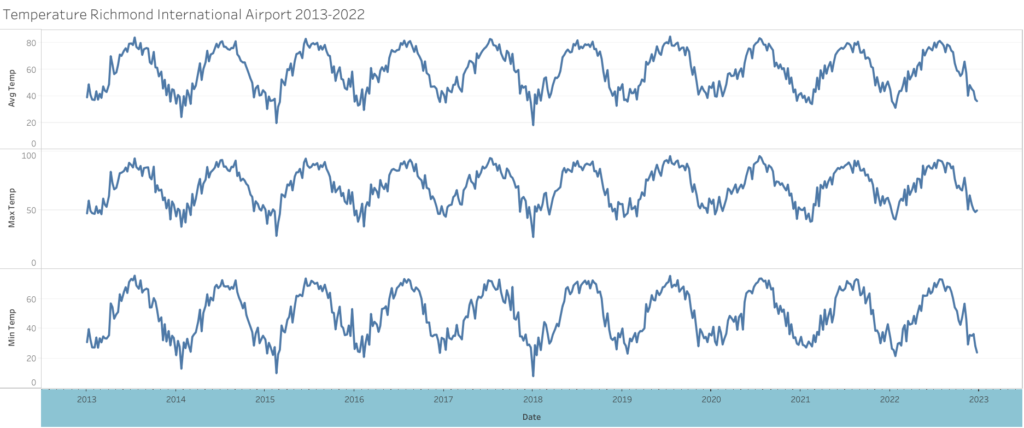
We can see a slight trend toward higher temperatures, but also some of the wilder temperature swings that occur with climate change. But with only ten years of data, the changes are slight.
Let’s look at the maximums and minimums, averaged by month, to get a better view of those trends.
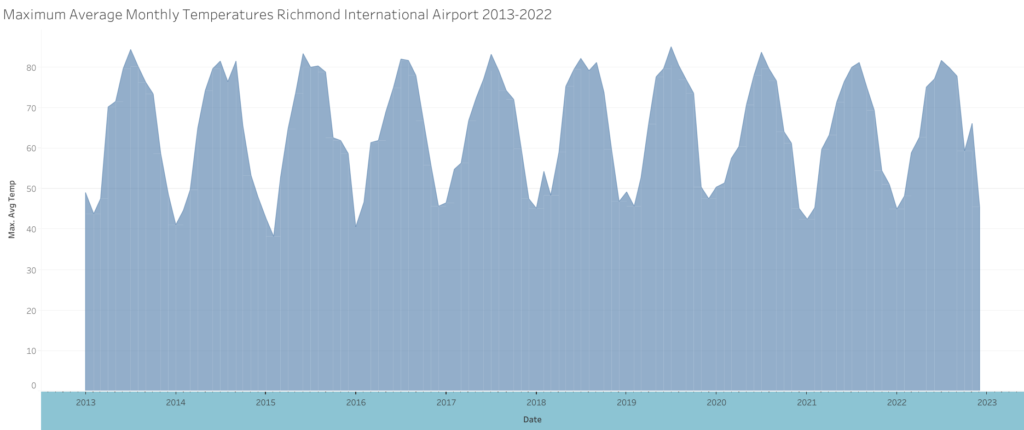
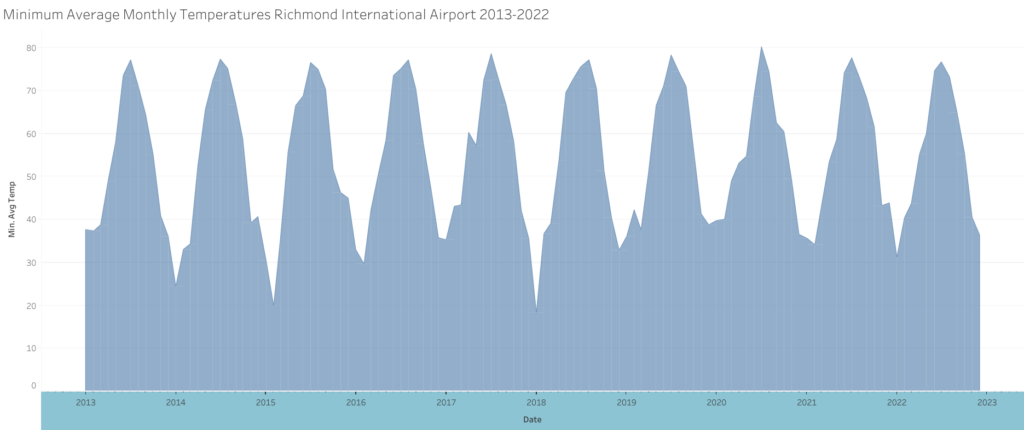
Now we can see that the maximum temperatures, when averaged over a month, are actually trending slightly downward. It’s also easier to see the dramatic dips of low temperature that occurred in 2014, 2015, and 2018.
But there are overall warmer temperatures, and that’s easiest to see when you look at average yearly temperatures below.
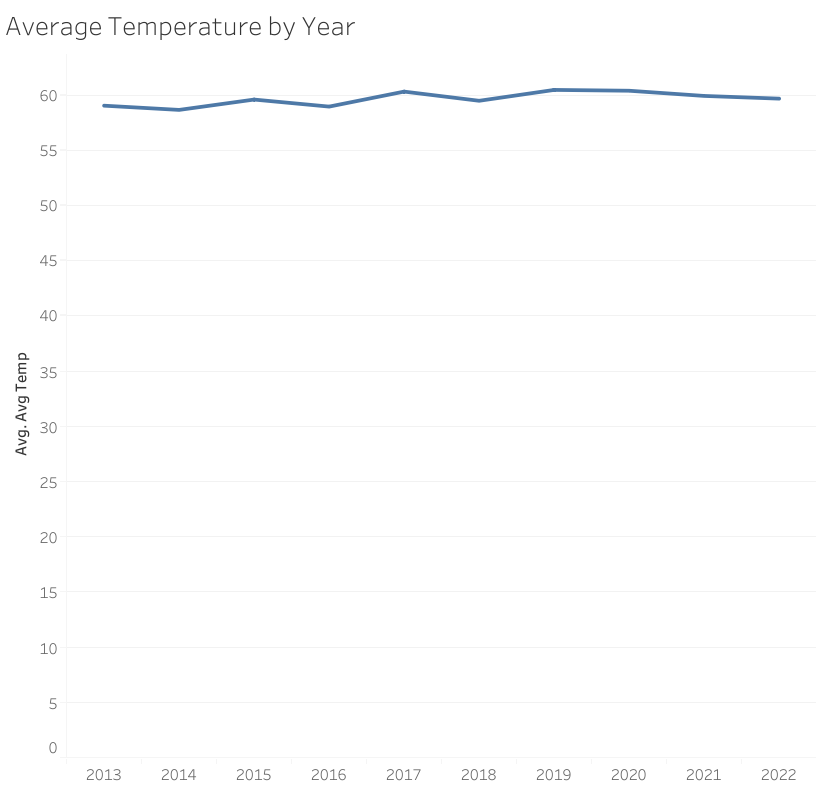
There’s a clear trend upward, and in terms of climate a single degree makes a big difference. Over a longer time period than ten years, this upward change would be much more dramatic.
Okay, time to look at some birds.
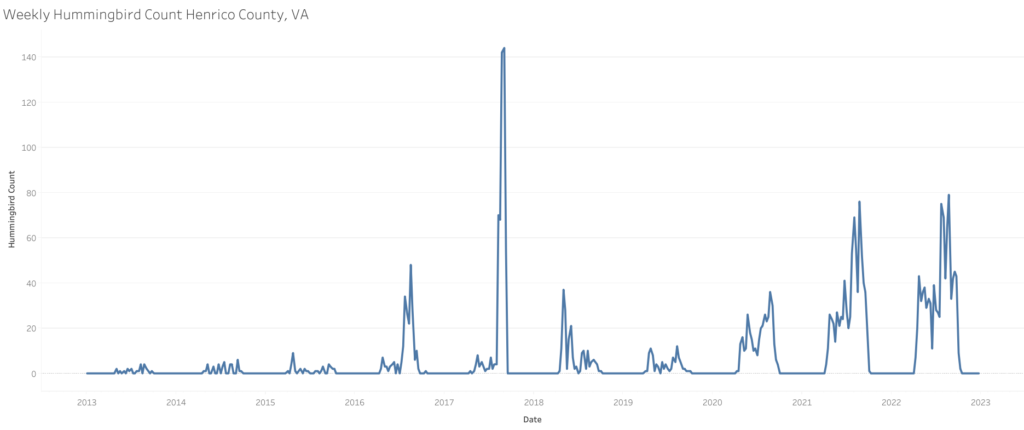
Whoa.
That’s different. Either we’ve got a whole lot more hummingbirds in Henrico County (plus a raucous bird party that occurred in the summer of 2017) or something else is going on here. (Hint: it’s the second one.)
While we know the counts for the time period, we don’t know the number of users for eBird in Henrico County, nor how many of those users were active. We don’t know if there was a local birding event or challenge, meaning that more people were actively looking for and recording hummingbirds during the spike. But that does seem more likely than some kind of avian convention (or parliament of fowls?) with hummingbirds carrying tiny briefcases.
Additionally, we do know that lockdowns in the spring of 2020 inspired many people to take up new hobbies that could be done while at home–including birding and setting up feeders. So that could explain the increase in numbers overall that we see in the last three years.
But we’re not done yet. Even if there are human factors influencing these numbers, there’s still a lot of weather data to compare. Let’s look at hummingbird sightings vs average temperatures, measured weekly.
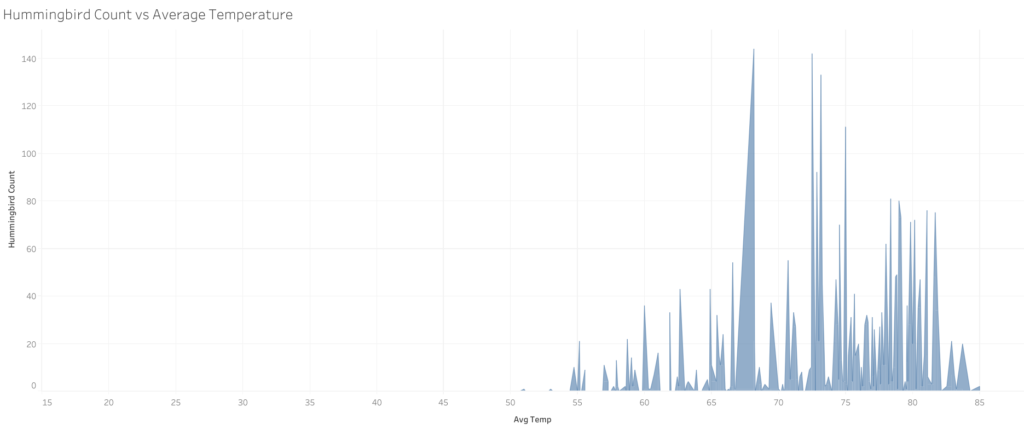
We start to see hummingbird counts when average temperatures reach 51. They really begin to rise in the mid-60s and drop sharply once we get to the low 80s. Either hummingbirds are less active or people are less likely to be out and about to observe them on the hottest days. According to Cornell, Virginia is in the breeding zone for hummingbirds, meaning they don’t entirely leave Virginia until they migrate south for the winter.
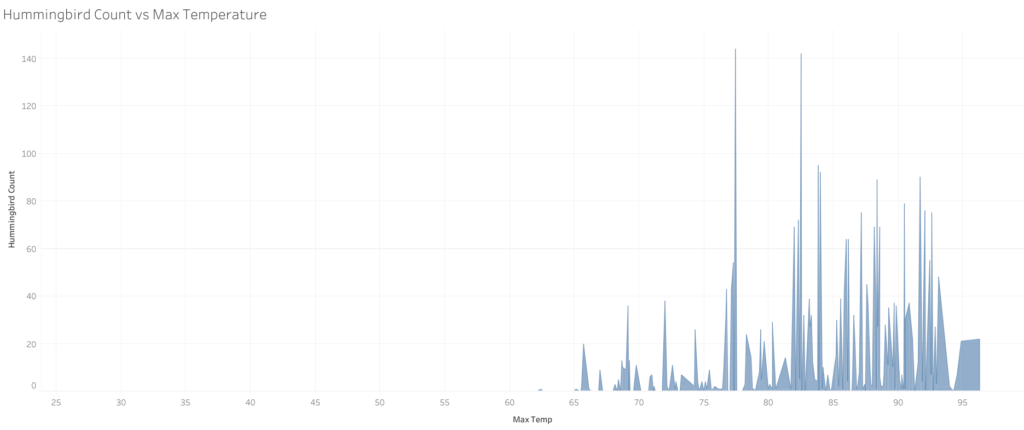
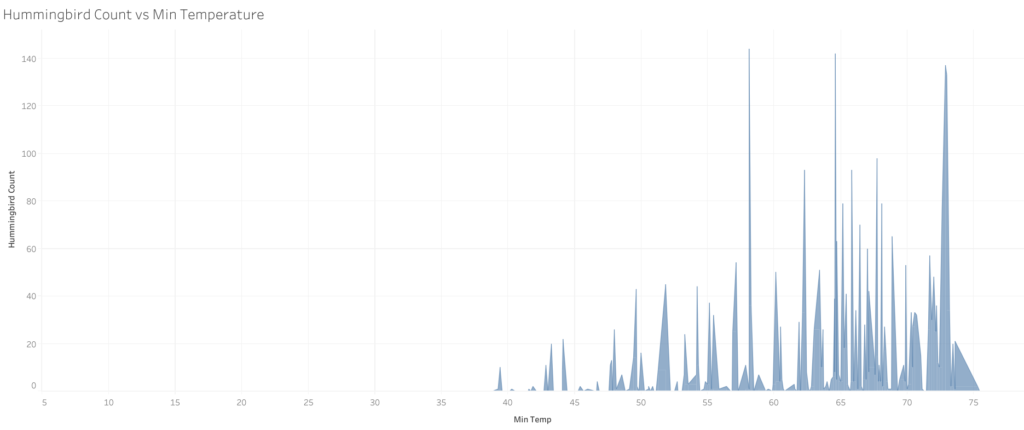
Comparison with maximum and minimum daily temperatures (again, averaged over a week to work with our weekly hummingbird counts) tells a similar story. Most sightings occur when the weather is mild to warm, but not too hot.
Next, let’s look at precipitation. Hummingbirds wouldn’t be around for a snowball fight, but they would experience rain in Virginia. Are they singing–ahem–humming in the rain?
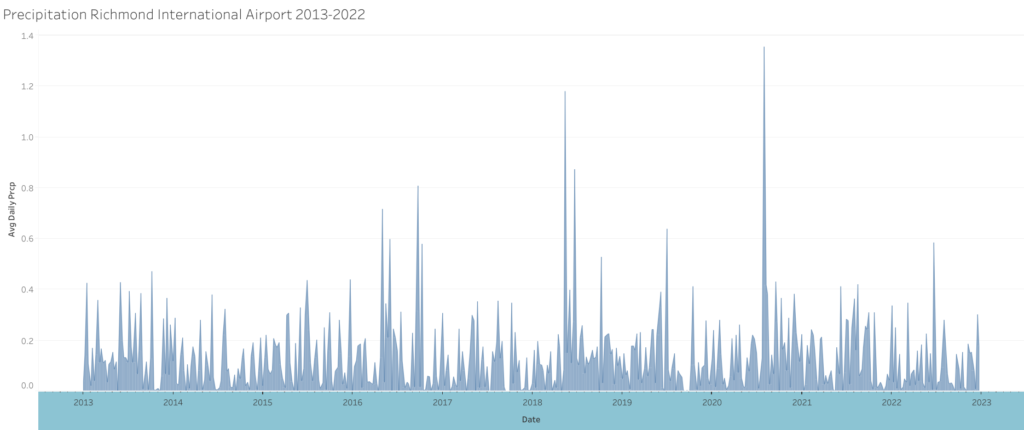
Here we have the average daily precipitation, shown by week. There were some especially rainy or snowy weeks, but no big trends over this ten-year period.
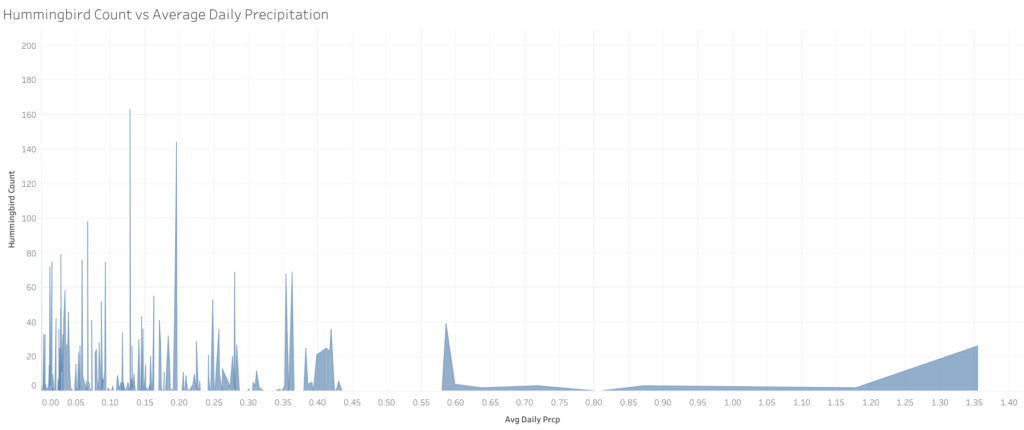
And here we can compare that average daily precipitation with our weekly hummingbird counts. With some outliers, we largely see more hummingbird observations on drier weeks. Either the birds are hiding from the rain, feeding in less observable locations or fewer people are willing to get wet to go looking for them. Or some combination of both of these factors.
What about the length of time in which we have hummingbird counts, or “hummingbird season?” Below are the start and end dates for hummingbird observations in Henrico County.
| Year | Earliest | Latest |
| 2013 | 5/1 | 9/22 |
| 2014 | 4/22 | 9/22 |
| 2015 | 4/1 | 10/8 |
| 2016 | 4/15 | 10/15 |
| 2017 | 4/15 | 9/8 |
| 2018 | 4/15 | 10/1 |
| 2019 | 4/1 | 10/1 |
| 2020 | 4/8 | 9/22 |
| 2021 | 4/8 | 10/1 |
| 2022 | 4/8 | 10/8 |
And we can lay out the dates visually too. Below you can see the earliest and latest observations by week number. (Remember, this is out of 48, rather than 52, weeks.) There is a trend toward earlier first observations and later final observations. You can also see the length of the season in days trending upward. Since this is calculated from weekly bird observations, with inconsistent week-length, these numbers are slightly off what they would be with daily bird data.
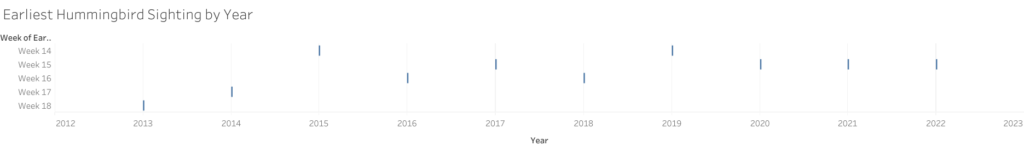
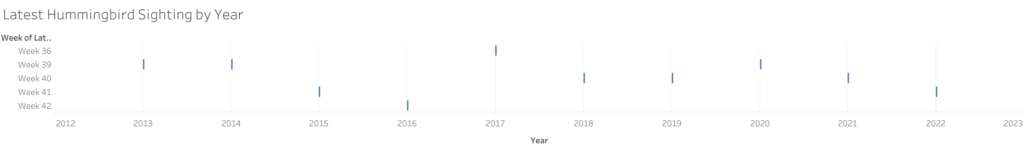
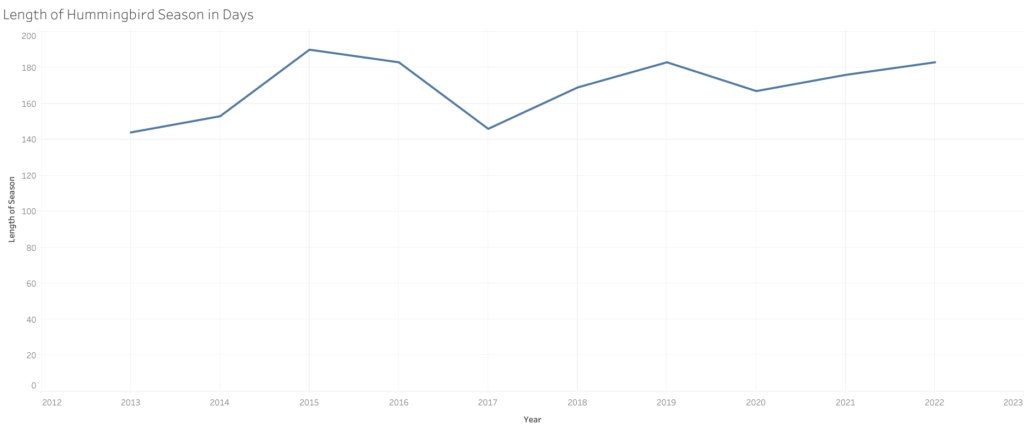
We have a longer season, but why? There was a slight increase in overall temperatures in this period, but there was probably also an increase in eBird users. More people looking for birds means more birds spotted overall and increases the likelihood of hummingbird observations at times when there are fewer of them, the very beginning and end of the season.
So, what does this all tell us, and what can the hummingbird watchers expect from the future?
We are seeing rising temperatures overall, as well as some dramatic temperature swings, expected for climate change. And eBird is reporting a longer hummingbird season, but the fact that recent years have seen an increase in total hummingbird counts, not just a longer season, indicates that there are more users of the site and app than there once were. Which, in turn, means more eyes on the skies to spot those early and late birds. And, ultimately, one county over a ten-year period is a very small sample size, which means it’s hard to make predictions from it.
We have a lot of “probablies.” We’ll probably see more hummingbirds recorded in eBird and longer seasons, but some change may be due to increased use and some change may be due to climate change. As global temperatures rise, you may see these birds humming through your garden for more and more of the year. If you love hummingbirds, be on the lookout for them, and consider contributing to eBird’s data. And if you don’t like hummingbirds–well, I’m surprised you made it this far in the article.
Now, none of what I’ve shared here covers the potential consequences. What does it mean for the birds if they hang out up north longer than they once did? And what does it mean for the ecosystems in which they linger…or don’t?
I guess we’ll find out.
Learning Analytics Reflection
I wanted to include this section, at least for the first few projects, as a help to others who are learning data analytics. This was a fun first self-directed project. They say to pick something you are passionate about, and it’s solid advice.
The main takeaway I have from this project is that real data is messy! Note the way eBird divided up the year into 48, rather than 52, weeks. It meant digging around for a solution that made the data play nicely with the weather data.
Also, as I began learning R while completing this project using Excel and SQL, I couldn’t help but continually think, “This could have been so much easier!” But that’s part of the learning process, and I look forward to completing future projects in R and Python as I get more comfortable using each of those languages. In fact, eBird has a package for R if you want to play around with it. I know I’ll be pondering more bird-related questions to answer.